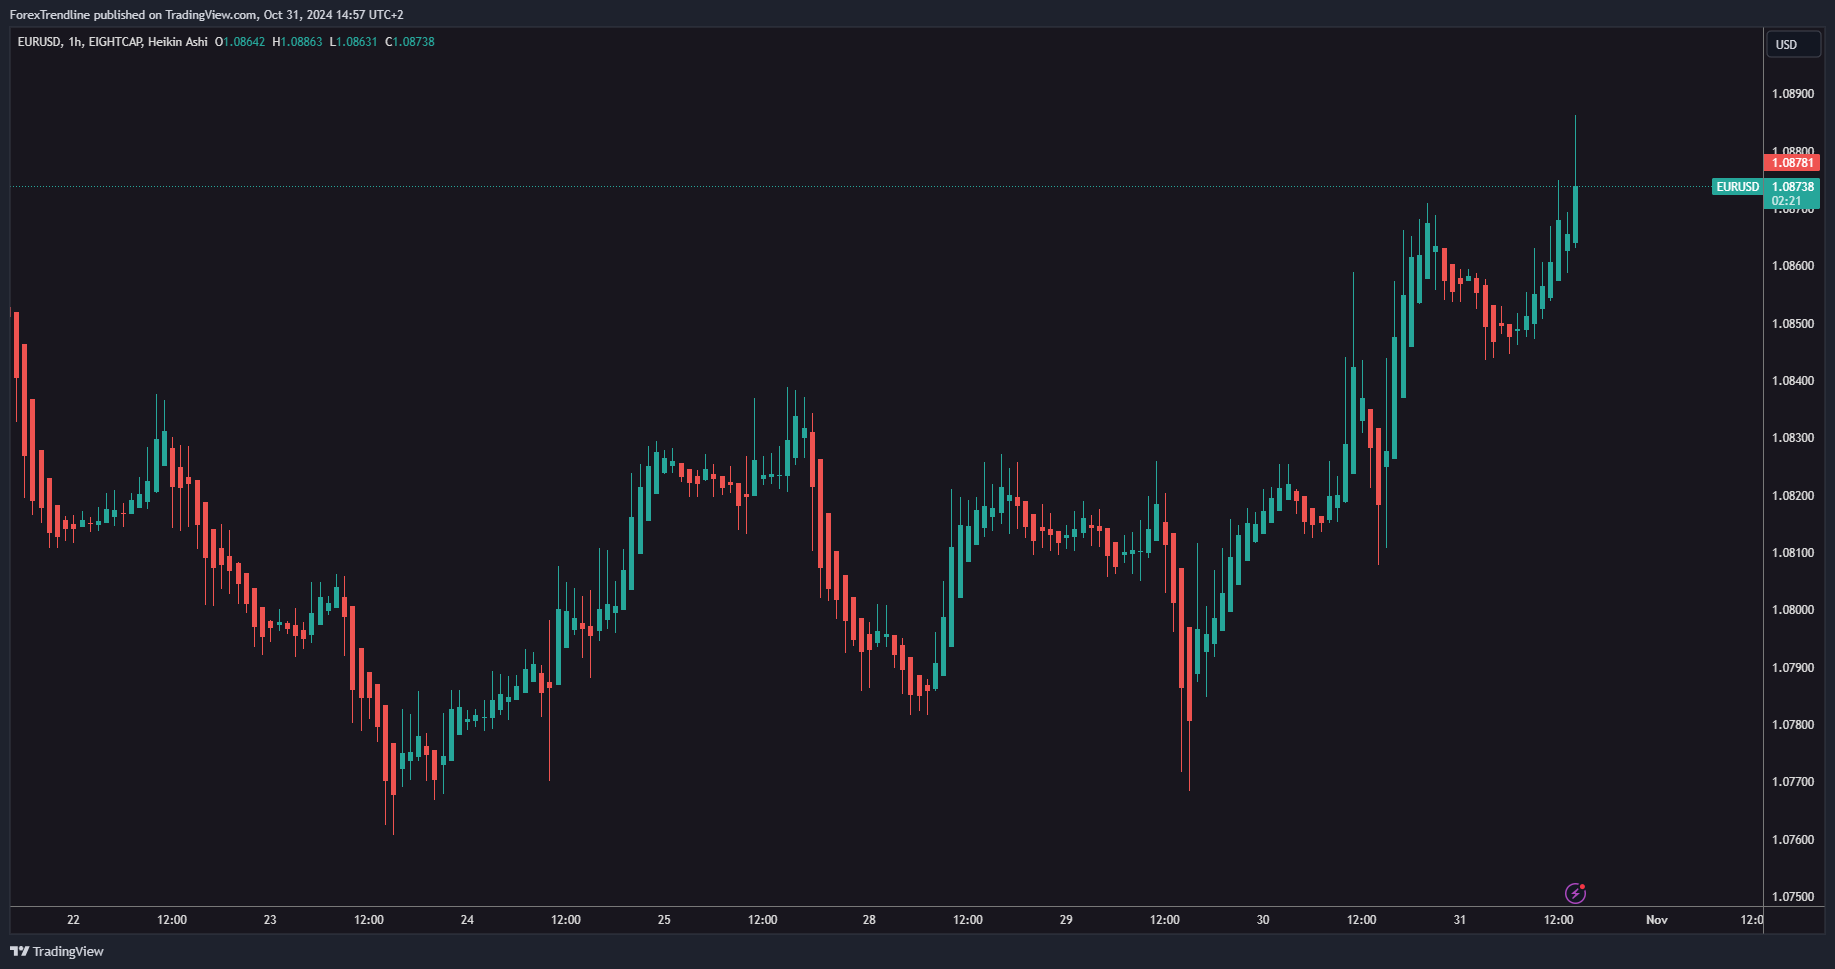
When performing technical analysis in the financial markets, there are many techniques for interpreting price movements, and one of them is Heikin Ashi.
This article will cover its definition, origin, calculation method, and key advantages and disadvantages.
Content
What is Heikin Ashi
History and origin of Heikin Ashi
How are Heikin Ashi candles calculated
Pros and Cons of the Heikin Ashi Charts
What is Heikin Ashi
Heikin Ashi candlesticks are a popular tool in technical analysis, helping traders identify potential reversals, continuations, or consolidations in the Forex market. Their primary distinction from standard charts lies in the unique way their candles are constructed.
While traditional Japanese candlesticks show the exact price movement for a specific period, Heikin Ashi gives information on averaged price data. This feature makes them a useful tool for those who want to follow the general trend rather than focusing on short-term price fluctuations.

Heikin Ashi chart
History and origin of Heikin Ashi
The Heikin Ashi technique originated in Japan. The term translates as "average bar" in Japanese, which reflects the technique's main function – averaging price data. Heikin Ashi was developed as part of the broader technical analysis methods used in the Japanese markets, where traders were looking for a more efficient way to identify trends and price movements.
Over time, the technique has become a universal tool used by traders in various markets - stocks, forex, and commodities. The ability to filter out market noise and provide clear trend direction makes the Heikin Ashi chart an important element in many trading strategies.
How are Heikin Ashi candles calculated
Unlike traditional Japanese candlesticks, Heikin Ashi uses modified open, close, low, and high values. Each candle is calculated as an arithmetic average of both current and previous market data, which reduces 'noise' and shows smoother price movements. This feature makes Heikin Ashi a useful tool for spotting trends and potential market turning points.
The candle colors also provide information about market momentum. A long green candle without a lower wick indicates strong buying pressure, while a long red candle without an upper wick suggests strong selling pressure. On the other hand, a small candle with long upper and lower wicks (Doji) indicates indecision and a possible trend reversal.
Pros and Cons of the Heikin Ashi charts
Depending on your trading strategy, Heikin Ashi can be a very useful or limiting tool.
- Pros:
- clear trend identification – helps traders quickly and efficiently identify trends, making it useful for tracking long-term ones;
- ideal for swing trading – especially useful for swing traders as it highlights trends over extended periods. Smoother price movement helps to more clearly identify entry and exit points;
- easy to read – Heikin Ashi charts are easier to interpret than traditional patterns, making them beneficial for new traders.
- Cons:
- lagging indicator – because Heikin Ashi is calculated using data from previous periods, they usually lag behind actual price movements. This can lead to delayed signals, making it unsuitable for short-term traders;
- lack of accurate price data – unlike traditional candles that show the exact levels for a given period, Heikin Ashi provides an average view of the market;
- not suitable for all trading styles – day traders and scalpers may find Heikin Ashi less useful due to its delayed nature. They need more detailed data for quick decision-making, which traditional candles provide more effectively.
FREE FOREX TRAINING FOR BEGINNERS
If you want to trade GOLD, FOREX or other instruments and make real profits, our trading course is just for you. A complete beginner's guide in 38 video tutorials.
In summary, the Heikin Ashi is an excellent choice for swing traders and those who follow long-term trends, but it may not be as effective for short-termers who need accurate, real-time price data. Whether you want to apply it to your trading strategy or simply to better understand market trends, this tool is an excellent addition to your technical analysis.
Risk Warning: All products and services offered by "Forex Trendline" Ltd are for educational purposes only and do not constitute investment advice or a trading recommendation. Trading financial instruments carries a high level of risk and may result in losses. Past performance is not a guarantee of future success. We recommend that you read the full Terms and Conditions before using our services. Nothing on this site should be interpreted as investment advice from "Forex Trendline" Ltd or any of its representatives, directors, or employees.
© 2026 Trendline. All rights reserved

